How Better Data Can Help Tame the Freight Cycle
Freight Research • Published on August 26, 2020
An earlier version of this article was originally published by the Journal of Commerce.
In the freight industry, the idea of cycles has become as close as there is to biblical truth. But the two most common explanations tend to overlook a third, less intuitive, reason: Inadequate data.
Explanations for what drives these freight industry booms and busts typically boil down to two reasons: (1) Cyclicality in the major industrial sectors driving marginal truckload demand, and (2) the delayed response of carrier supply to shifts in truckload demand.
Both of these explanations make sense.
Output and activity in some industries that drive truckload demand is very stable over the business cycle — for instance, consumer staples or groceries. In other industries — such as natural resource extraction or construction — activity is much more prone to sector-specific booms and busts.
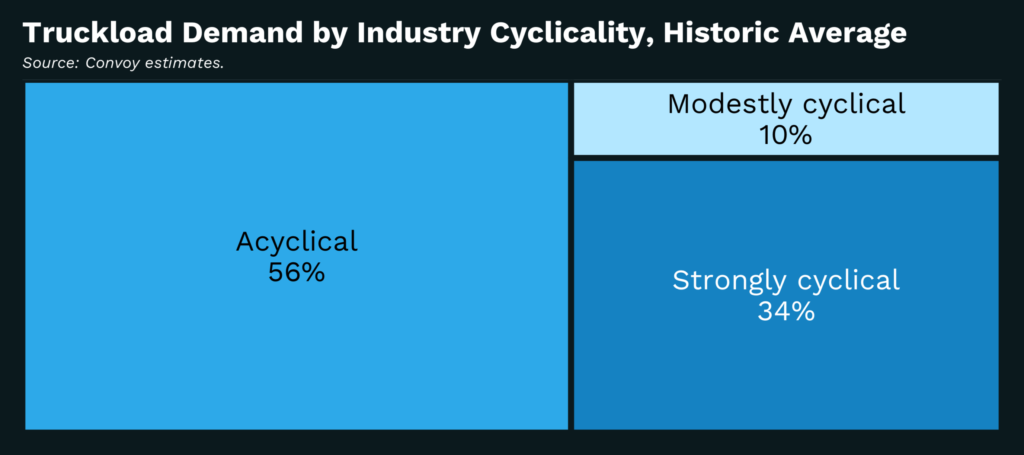
On average over the past two decades, about a third of truckload demand comes from strongly cyclical sectors (e.g., construction) — meaning industries where output follows a regular pattern of expansions and contractions and about half of demand comes from acyclical sectors (e.g., refrigerated foods or plastics). The remaining tenth comes from modestly cyclical sectors (e.g., apparel) where output cycles are smaller in magnitude or less regular in frequency.

Another common explanation for freight industry cycles is the lagging response of carrier supply to independent shifts in truckload demand. This is the logic of the “invisible hand” — familiar to anyone with exposure to basic economics.
When the market signals insufficient supply through rising prices, existing carriers add new capacity (buying new trucks and hiring new drivers) and new carriers enter — albeit with some time delay — pushing prices back down. Equally, when the market signals excess supply through falling prices, existing carriers reduce capacity or exit and there are fewer new entrants pushing rates up, again with a delay. The delays cause short-lived periods of over- or under-investment in supply contributing to a cyclical pattern in prices.
But there is also a third — largely overlooked and less intuitive — explanation for freight’s booms and busts: Inadequate data. In order to understand this third reason, it is necessary to take a brief detour into the field of empirical asset pricing.
There are a handful of commonly-applied statistical approaches to modeling asset prices — be it a truck, a stock, a house, or something else.
The most widely used approach in the freight industry is known as “hedonic price modeling”. Its basic insight is that we can estimate the price of any “thing” by looking at recent transactions for that “thing” and attempt to control for relevant characteristics that could plausibly change the price. There is a wide range in sophistication of hedonic models, but the core idea is all the same: Estimate a price by looking at comparable recent transactions.
An alternative approach to asset pricing is based on the insight that the price of any “thing” should be the cost to (re)produce it (at least in a competitive market). In the case of a home: Add up the costs for all the materials, labor and land. In the case of trucking: Add up a carrier’s vehicle financing costs, maintenance, insurance, fuel, the driver’s salary (or equivalent).
Hedonic modeling is appealing because it relies on relatively simple data — you only need recent transactions and some characteristics (e.g., in trucking, route distance or truck type). Data on replacement costs are much more difficult to come by — the most commonly used sources are not sufficiently granular or high enough frequency for applied use.
But hedonic modeling has a big limitation: If “things” are worth whatever the market will pay for them, pricing can easily become untethered from suppliers’ costs (on the downside) or more rational buyers’ willingness to pay (on the upside) — a phenomenon coined “irrational exuberance”. (The more pessimistic counterpart of “irrational exuberance” is known as “irrational gloom.”) Prices estimated by hedonic modeling are about twice as volatile as prices estimated from underlying costs, and much more prone to cyclical fluctuations.
Most freight analysis is quick to point the finger at the invisible hand of supply and demand to explain trucking’s well-documented booms and busts, but that narrow focus risks overlooking the procyclical nudge from the industry’s most commonly used pricing approaches. The problem is not with one model or the other — each has its own strengths and limitations; it’s when everyone is relying on the same approaches and the same data.
Inadequate data and a historic aversion to transparency forces freight market participants to follow the herd rather than to act rationally. Shippers, carriers and market-makers should demand more from our data. If we do, the whole industry stands to benefit from a tamer freight cycle.


